출처
http://www.theserverside.com/tt/articles/article.tss?l=PerformanceEngineering

나중에 심심할때 함 읽어봐야 겠다.
Context/Introduction
"The application is horribly slow.", "I don't get the response even after I get my coffee.", "This application is useless". Sounds familiar? How many times have we heard these quotes or or felt like that ourselves? The common thread between these statements is that the performance of the application is not good.
Performance - the (in)famous buzzword. What is it? What does it mean? In this article, we'll touch upon what is involved in testing an application for performance.
With every passing day, organizations are becoming more and more conscious about the performance of their Enterprise Solutions. As the IT industry matures and the technology evolves, so does the awareness about expectations from an Enterprise Application.
Focusing just on the design / implementation and Zero-functional-defect solutions are things of the past. With increasing maturity in technology and IT staff, the 'Non-functional' aspects of the system are fast becoming focus-areas.
So what exactly are the non-functional aspects and/or requirements?
Non-functional requirements (NFRs) tell the IT team, about the kinds of usage and load the application will be subjected to, and the expected response time. We'll go into the details of this "response time" shortly.
NFRs define the Service Level Agreements (SLAs) for the system and hence the overall Performance of the Enterprise Application. Besides performance SLAs, NFRs also cover several other aspects, such as security, but for this article we are concerned with performance related objectives only.
Managing and ensuring the NFRs (SLAs) for an Enterprise Application is called Performance Engineering. Performance engineering is a vast discipline in itself which includes Performance Modeling, Performance Prototyping, Performance Testing, different types of analyses, Performance Tuning, etc. This article will not explain Performance Engineering, Queuing Theory and the science behind the various laws. This article just covers the basics about the Performance Engineering and key activities in Performance Testing.
How to describe Performance of a 'System'
The performance of any system can be expressed in many ways by different stakeholders of the system. For example, When a business analyst gives performance (or non-functional) requirements, it might be in some format as follows:
- "there will be at least 100 users on the system all the time",
- "System should respond back in 'acceptable time'".
These statements have to be translated to somewhat more technical terms as described below. Once we understand these terms, we'll reword these Performance requirements.
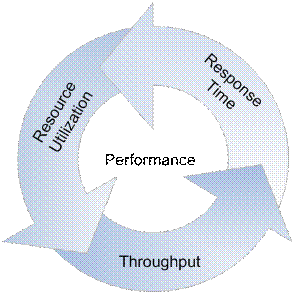
To define the performance of any System (Software/hardware/abstract) following technical parameters should always be used in conjunction -

- Response Time: Response time specifies the time taken by the system to respond back with the expected output. For an enterprise application Response time is defined as the time taken to complete a single business transaction. It is usually expressed in seconds.
- Throughput: Throughput refers to the rate which the system churns expected outputs when the designated input is fed in the system. In other words, for an Enterprise Application, throughput can be defined as the total number of business transactions completed by the application in unit time (per second or per hour).
Usually, per second or per hour is the standard, since per day (or per diem) is a very wide unit. Most business users utilize an Application during typical 8 hour business window. Normally there are some peaks & some troughs in the input, so the volumes per day should not be averaged to an hour. All the mathematical distributions (normal, Poisson, uniform) come handy over here.
- Resource Utilization: For any system to consume an input and produce the designated output, certain resources would be required. The amount of resources consumed by the system during processing that request, defines the resource utilization. There can be different resources factored in, such as processor, disk (i/o controller), memory etc. Utilization of 80% is considered an acceptable limit. Normally utilization of 70% warrants ordering of additional hardware.
Now that we know basic technical terms for expressing performance facts about a system, we'll try to rephrase the above Performance Requirements.
- We should ask the question whether all the users would be carrying out a transaction simultaneously or they would be just logged on. The answer of this question would lead us to the throughput expectations. In case of pre-existing applications (or using applications having similar profile), we can also arrive at the transactions/sec or throughput requirements from logs files (e.g., HTTP logs of web-applications.)
- The vagueness of "acceptable" times needs to be removed by defining the response time requirements clearly, e.g. 2 seconds, 2 hours or 2 days.
Let's begin then...
Performance test planning
He who fails to plan, plans to fail
As in all aspects of life, planning is very important in Performance Testing. We present the simplistic approach to planning a Performance testing exercise in the sub-sections below.
How to represent the SLAs? - Workload model/distribution/pattern
The first step of any IT project is usually requirements gathering. Similarly, for any performance testing project, its very important to gather the SLAs / NFR of the system against which the tests will designed and executed.

Performance testing depends as much on how well the SLAs are gathered as much as on how well they are represented. A well represented non-functional requirement can help a long way in the rest of the planning and analysis activities.
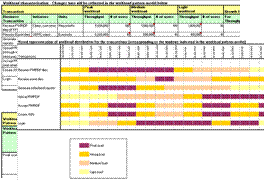
The various throughput rates, load figures, list of transactions, types of transactions, response times and projected growth in coming years are captured in a document called the Workload. Workload captures the load pattern, load distribution, transaction distribution, peak windows etc.
The workload should be thoroughly reviewed by the various stakeholders of the system, like, architects, business users, analysts, designers and performance engineers.
What to test? - Identifying Transactions
Once the Workload model has been prepared and reviewed thoroughly, the next step is to Identify candidate transactions. If we select too few transactions, the system might contain a serious SLA mismatch and if we select all the transactions, we might be heading towards a never ending performance test cycle.
The famous 80-20 rule comes in handy here. In most applications, 20% of the transactions cover 80% of application's core functionality (to be confirmed with the help of application experts). Once the workload model has been created, this step is fairly easy and straight forward.
It's also important to classify the transactions as the Performance Testing would be carried out differently for each type. The transactions could be very broadly categorized as online - where user submits a request and gets a response, and batch - where user submits a list of jobs and does not wait for the completion. The transaction mix also has to be identified, viz. transaction A has 50% requests, transaction B has 30%, and transaction C has 20%. All of A, B, C can occur together. This helps in deciding the mixed tests.
Also at times, there might be certain transactions which do not qualify as candidate transactions according to the 80/20 rule, but might be critical to business. Such transactions should also be considered for performance tests and all such transactions can be clubbed in one run to get a benchmark reading for analysis.
Where to perform tests? - Environment Setup & Planning
For Performance Testing, it is ideal to get an environment with the same capacity as the production/live environment. Many developers are of the opinion that one deliverable/outcome of performance testing/engineering exercise is to provide hardware projection for production use, which is perfectly right. Capacity projection and Production hardware gauging is altogether a vast topic. So for simplicity sake, we restrain ourselves to Production like environment (considering an earlier release of the application is already live on some hardware).
Besides the deployment hardware, there are many other pieces of hardware that would be needed to facilitate load testing. These can be broadly classified as load generation nodes, stub nodes and monitoring.
Load generation nodes are the machines used to generate load for the applications. These nodes are used to host the load generating software, such as LoadRunner, WinRunner, etc. Some open source alternatives are also available. Some custom scripts will have to be written which can run on these nodes to generate load on the system. These tools also help in monitoring the resource utilizations.
However it is not mandatory to use only these tools. Depending on the complexity some custom stubs may be written to do the testing.
Monitoring nodes usually can be the same as load generating nodes, since most of the load-generating software packages are also equipped with monitoring capabilities. Monitoring is an inherent aspect of Performance Testing. All the resource utilizations need to be monitored throughout the duration of the test to
- ensure all the utilizations are within limits
- identify the bottlenecks
- The rate at which transactions are completing
- Number of failed transactions...etc...
Stub nodes are the ones which will be usually hosting a stub to simulate some part of the software or external system that can not be included in the performance test runs - such camera or scanner devices that are operated manually, which wouldn't be a valid option for a repeatable performance test.
Data Preparation
Any enterprise system is usually programmed to process data. Thus, data planning for the performance testing of the system is a vital step. This directly affects the success of the Performance Testing exercise.
Data required for load tests can be broadly categorized as -
Initial/Retention Data - The performance of database is very much dependent on the amount of data present in the tables. When the application is in production, there is certain amount of data present in respective tables. While carrying out performance testing, it is necessary to have at least equal amount of data in the Test environment. In fact, depending on the system upgrade plans, the data in the test environment could be a multiple of production data.
Having same amount of data is one thing, and using the same distribution of data as in production is another. The distributions of data straight away affect the index performance and in turn the application performance.
The amount of data and its distribution should be validated by business and/or IT dept. before proceeding with Performance Testing.
Test Data - Once the retention data is fine, we turn our attention to test data. The same concepts as amount and distribution apply to test data as well. This time, we have to take concurrency into consideration too.
Designing scenarios
Any testing activity is comprised of the test cases and test-suite encompassing those tests. For performance testing there are some standard tests which are usually conducted on the candidate transactions of the system, depending on the nature of those transactions. The following subsections give a brief insight in each of those test scenarios.
Isolated runs
"Isolated" means running one transaction at a time. By running a single transaction and observing its behavior, we can see if it is able to utilize the hardware well. We can also see if it is able to meet its throughput requirements by running alone at least. The readings taken can also help in capacity planning (part of advanced Performance Engineering).
Usually isolated runs are preceded by Baseline / Calibration runs, where in just a single run of each transaction is executed to get the benchmark response times for all candidate transactions.
Mixed runs
"Mixed" means running all/multiple transactions simultaneously. This helps in identifying if all the transaction throughputs are met when multiple transactions are occurring parallely, i.e., it also tells us the effect of transactions on each other.
There are two schools of thought in the order of execution of these tests.
- First, run mixed test in the beginning. If everything is fine, then we are saved efforts for isolated tests.
- Second, run isolated tests in the beginning followed by mixed test. This is more useful when you want to determine the scalability of the application and do any capacity planning.
Trickle feed
This is mainly applicable in case of batch type of loads - e.g. the load may come as 'n' messages per five minute block.
Backlog runs
This is a typical batch load. Sometimes it might happen that the application receiving messages (say Application A) is down for long time, but the feeding application (say Application B) is continuously putting messages. Now when the application A comes up, how it behaves, can be found out by this testing.
Endurance
It has been observed that whenever a system is running for multiple days or months without downtime, its memory utilization increases or throughput falls or some exceptions occur. To find out if the application behaves fine even if run for longer duration, this test is used.
Stress
Sometimes, as the load on the system increases, e.g. on Christmas Eve for retail or shipping applications, the system throws errors or behaves unexpectedly. The stress test targets exactly this behavior. Determining that the software handles the load gracefully without crashing is the aim of this test.
Preparing Reports
Presenting results in an understandable format is normally a neglected area. If you don't do that, you are reaping only 20-30% benefits of Performance Testing. Properly presented results will enable business stakeholders to make informed decisions. Also, when it is time to do Performance Testing for the next version of the same application and if you don't have properly documented results (and if the people who did the exercise are gone), then you need to start all over again.
Key graphs
Here are some key graphs that should be created while executing Performance Testing and should be presented in a Performance Test Report.

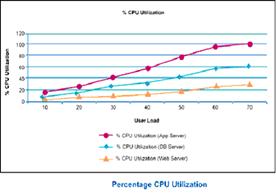
CPU Utilization vs. No. of users
This graph tells us whether the CPU utilization increases with increasing users. It also tells us about bottlenecks as well as what is the maximum number of users that can be supported.
Throughput vs. number of users
This graph tells us if throughput increases with increasing number of users. This graph should have a similar shape as CPU Utilization graph.

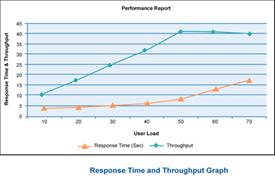
Response Time vs. throughput
The response time should be fairly constant with increasing throughput. If it is not, it is most likely a bottleneck.
Besides the above mentioned graphs, depending on the nature of transactions and criticality of various components, a few other graphs can also be included in the report, such as network bandwidth & latency graphs, memory utilization graphs, disk / i-o utilization graphs for disk/i-o intensive operations, etc.
Best Practices
Automation with handy scripts
Script writing is an inherent part of any Performance Testing exercise. A lot of time is spent in ensuring the begin state of the test is proper. It might involve restarting servers, deleting extra data other than retention data, cleaning up log files, taking backup of some data, checking if some pattern exists in a log file, etc. Since each test needs to be run for 'n' number of times, automating these small tasks goes a long way in reducing time needed for each run.
Identify DB backups after crucial runs
During the course of Performance Testing activity there are bound to be different patches on application, database side. These changes are seemingly trivial but potentially devastating. It is a good idea to take the backup of data in the database and configuration files for the application before applying new patches to either application or DB.
Cross check Little's law
One of the basic queuing theory principles applied in SPE (Software Performance Engineering) is Little's law (a). It states that the total number of users in the system is equal to the product of throughput and response time. While calibrating your load test runs, one should always cross check the test results (throughput, response time, user-load simulated) to identify whether the load generator nodes themselves are not becoming the bottleneck in the system.
Designing scenarios to achieve right mix of transactions
Do not tune, if you don't have to.
There is a thin line separating Performance testing from Performance tuning. Unless really required, the tuning of various parameters of different components in the system should not be done. You will find many articles, which warn against tuning the systems. Most of the system components come with default values that are optimal. If we start looking for tuning of all the components, the duration of performance testing exercise will no longer be under control.
People Aspect
Performance Testing is a very strategic activity in the lifecycle of any Application. More often than not, you will have to deal with stakeholders who are apprehensive about the need of this activity, some people (especially DB, OS admins) who don't want the extra load this activity puts on them, software vendors who don't want additional defects on them, and many more. For the success of Performance Testing, it is important to take all these people along & explain (or thrust as the case might be) the inevitability of this exercise & how life would be easier when the application goes in production.
Environment availability is the biggest constraint which might force working in shifts, long hours, etc.
References
- (a) Quantitative System Performance, Computer System Analysis Using Queuing Network Models - Edward D. Lazowska, John Zahorjan, G. Scott Graham & Kenneth C. Sevcik
- http://www.ibm.com/developerworks/java/library/j-perf10283/
Authors
Alok Mahajan is Technical Architect with Infosys Technologies and specializes in Performance Engineering and Database designs. He has a total experience of more than7 years and has worked extensively on Performance Engineering assignments for more than 2 years, which uniquely positions him to write on the subject of performance. His areas of interest include Business Intelligence, Databases, Datawarehouse design/modeling.
Nikhil Sharma is Technical Architect with Infosys Technologies. For more than7 years, he has been involved in architecting and designing Enterprise Applications primarily on J2EE platform. For past2 years he has been working on Performance Engineering projects. He is also a Sun Certified Enterprise Architect for J2EE Platform (SCEA). His areas of interests are SOA, Integration Architectures, Portals.
'Good articles' 카테고리의 다른 글
| Backend Architectures (0) | 2013.08.19 |
|---|---|
| 구글 코드 대학 이라는 것이 있었구나. (0) | 2012.05.03 |
| 유튜브의 7년간의 확장(Scalability) 이야기 (0) | 2012.05.02 |
| [Good Article] C++로 돌아가는 자바를 읽고 (0) | 2008.04.16 |


